With Bitcoin now making six-figure territory seem normal and higher prices seem inevitable, analysis of key on-chain data provides valuable insights into the market’s underlying health. By understanding these parameters, investors can better anticipate price movements and prepare for potential market peaks or even any impending retracements.
Terminal price
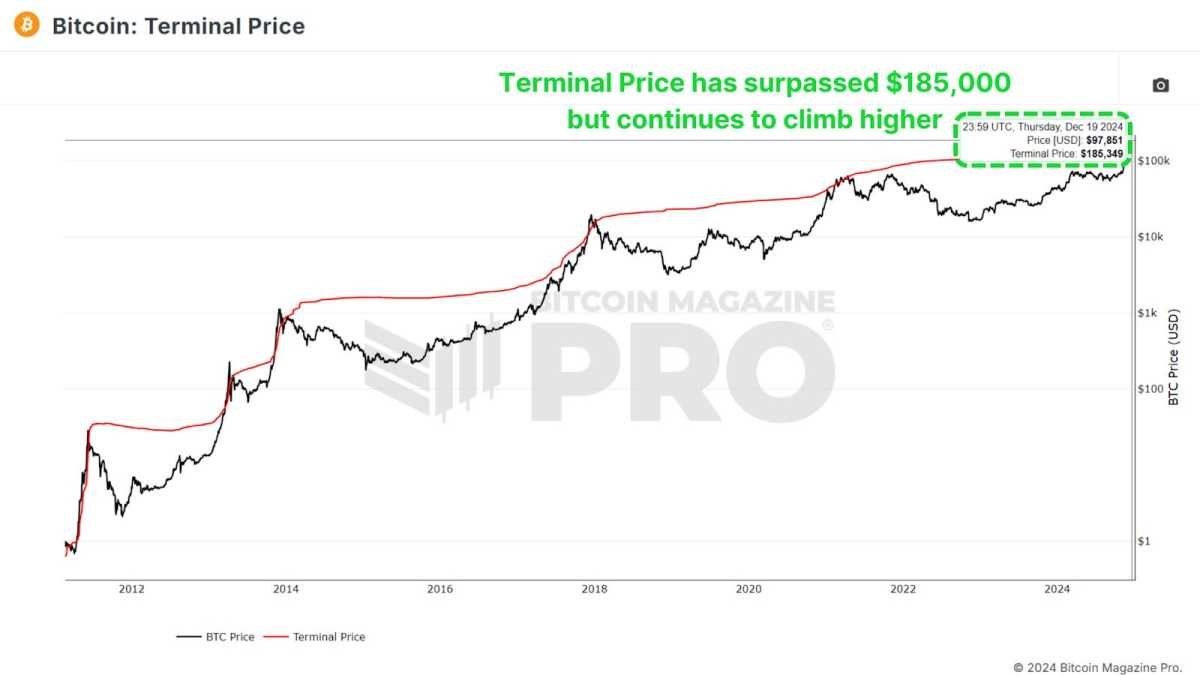
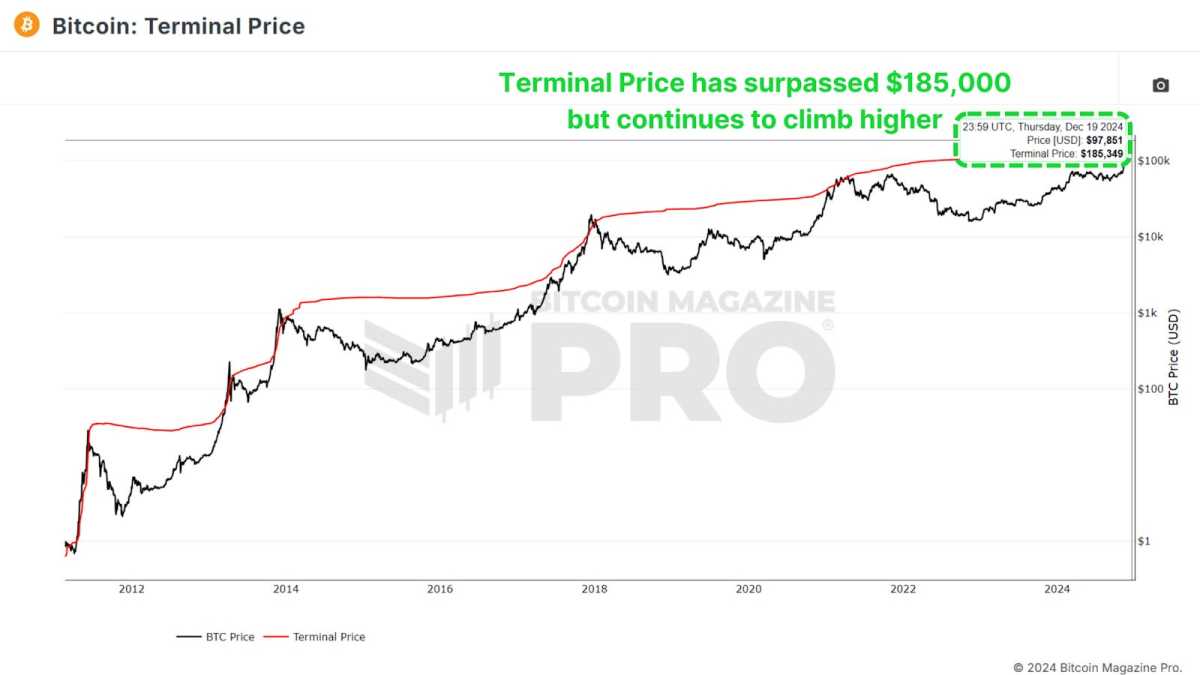
The terminal price metric, which incorporates Coin Days Destroyed (CDD) taking into account Bitcoin’s supply, has historically been a reliable indicator for predicting Bitcoin’s cycle peaks. Coin Days Destroyed measures the speed of coins transferred, considering both the holding duration and the amount of Bitcoin moved.
View the graph in real time 🔍
Currently, the final price has surpassed $185,000 and is likely to rise towards $200,000 as the cycle progresses. With Bitcoin having already surpassed $100,000, this suggests that we may still have several months of positive price action ahead.
Puell Multiple
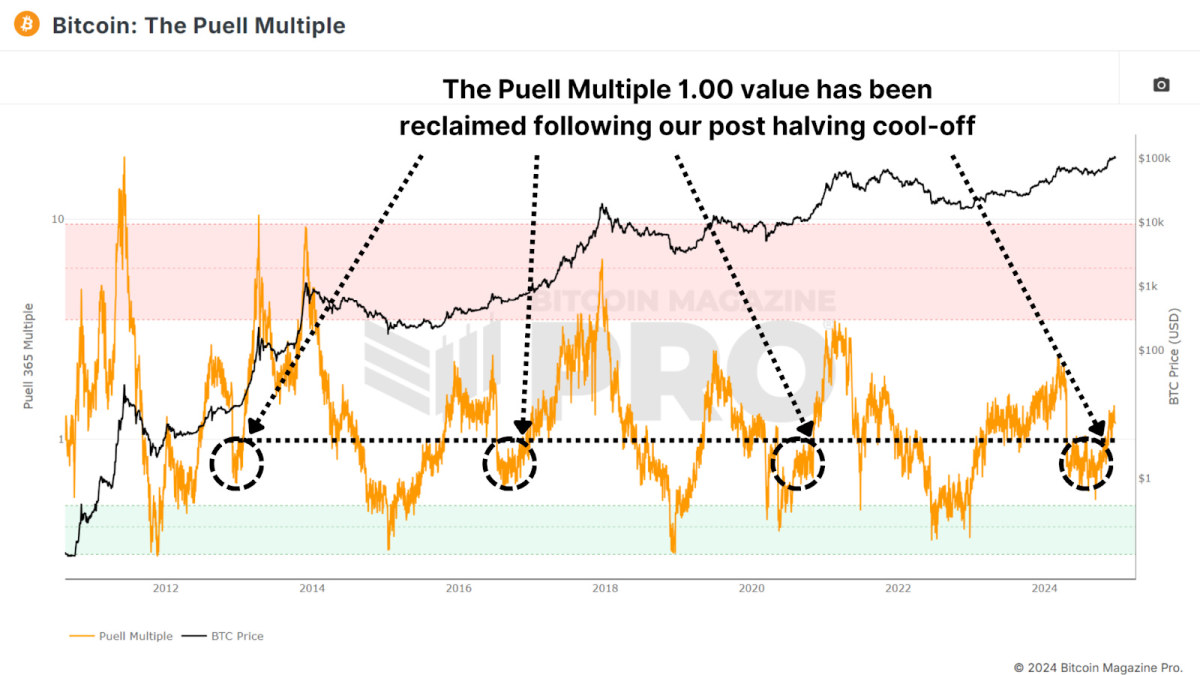
The Puell Multiple evaluates miners’ daily earnings (in USD) against the 365-day moving average. After the halving, miners saw a sharp drop in revenue, creating a period of consolidation.
View the graph in real time 🔍
Now, the Puell Multiple has climbed back above 1, signaling a return to profitability for miners. Historically, exceeding this threshold indicates the subsequent stages of a bullish cycle, often marked by exponential price increases. A similar pattern has been observed during all previous bull runs.
MVRV Z-score
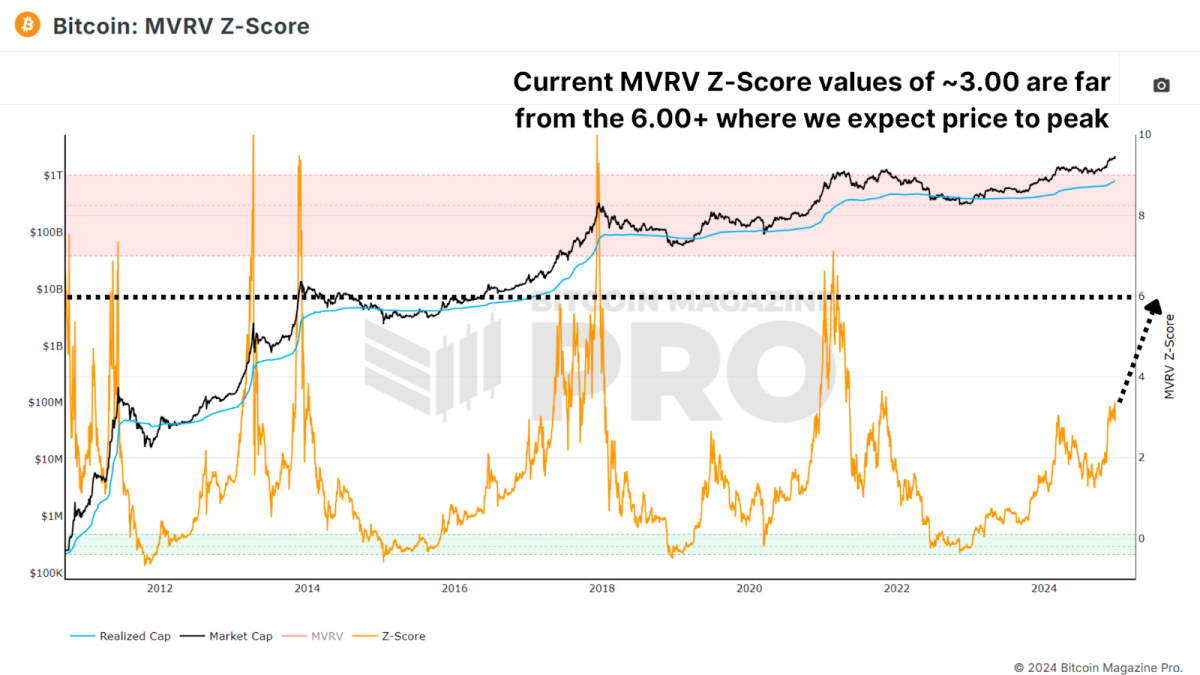
The MVRV Z-Score measures market value versus realized value (average cost basis of Bitcoin holders). Standardized into a Z-score to account for asset volatility, it was extremely accurate in identifying the peaks and troughs of the cycle.
View the graph in real time 🔍
Currently, Bitcoin’s MVRV Z-Score remains below the overheated red zone with a value of around 3.00, signaling that there is still room for growth. While decreasing highs have been a trend in recent cycles, the Z-Score suggests that the market is far from reaching a euphoric high.
Active address sentiment
This metric tracks the 28-day percentage change in active network addresses along with the price change over the same period. When price growth outpaces network activity, this suggests that the market may be overbought in the short term, as positive price action may not be sustainable given network usage.
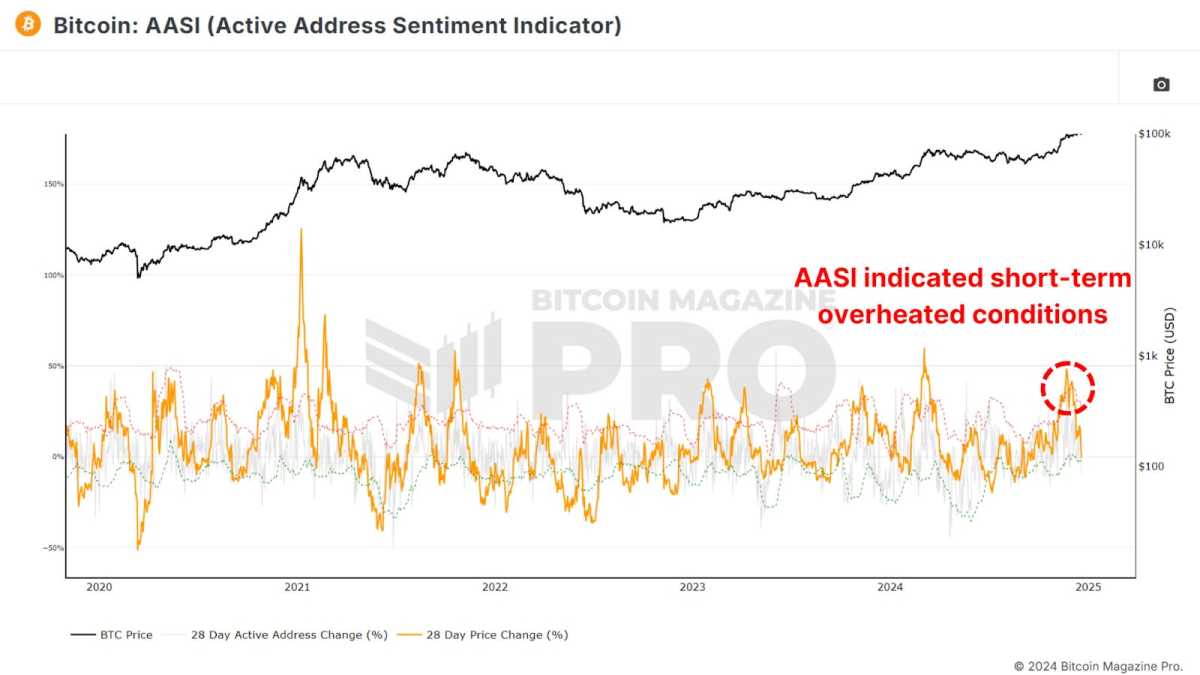
View the graph in real time 🔍
Recent data shows a slight cooling after Bitcoin’s rapid rise from $50,000 to $100,000, indicating a healthy period of consolidation. This pause is likely setting the stage for long-term sustained growth and does not indicate that we should be bearish in the medium to long term.
Product profit spent ratio
The Spent Output Profit Ratio (SOPR) measures the profits made from Bitcoin transactions. Recent data shows an increase in profit taking, potentially indicating that we are entering the latter stages of the cycle.
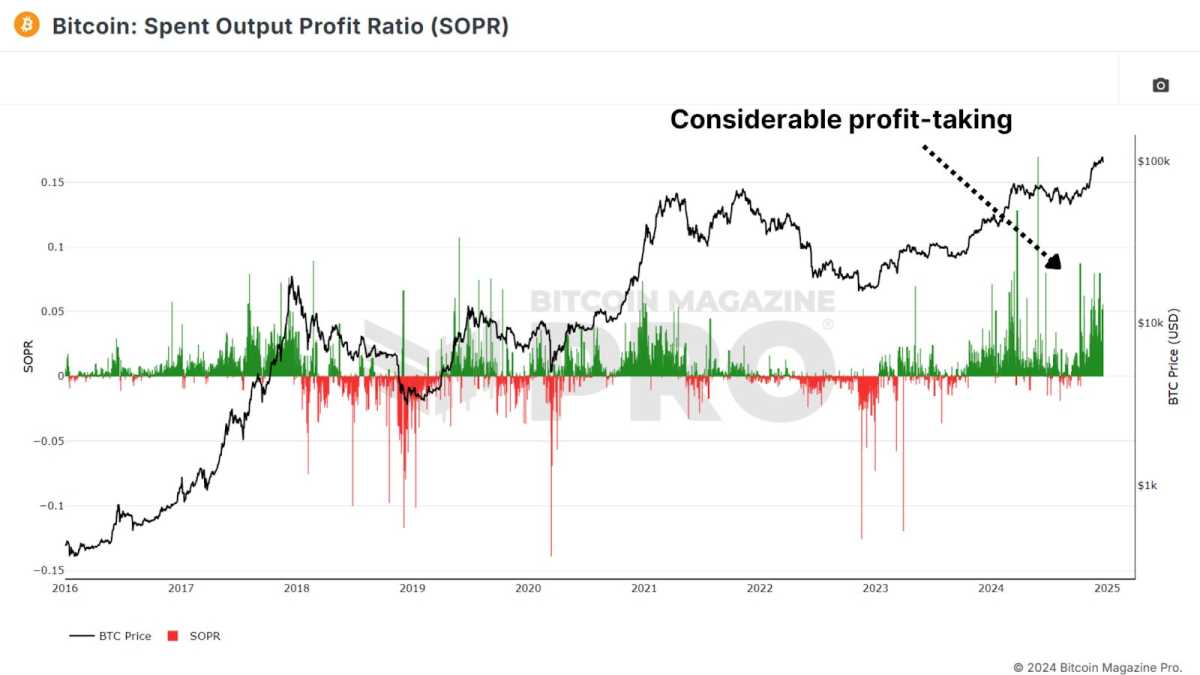
View the graph in real time 🔍
One caveat to consider is the growing use of Bitcoin ETFs and derivative products. Investors may switch from self-custody to ETFs for ease of use and tax advantages, which could affect SOPR values.
Days of value destroyed
The Value Days Destroyed (VDD) multiple expands the CDD by weighting larger, longer-term holders. When this metric enters the overheated red zone, it often signals major price spikes as larger, more experienced market participants begin to cash out.
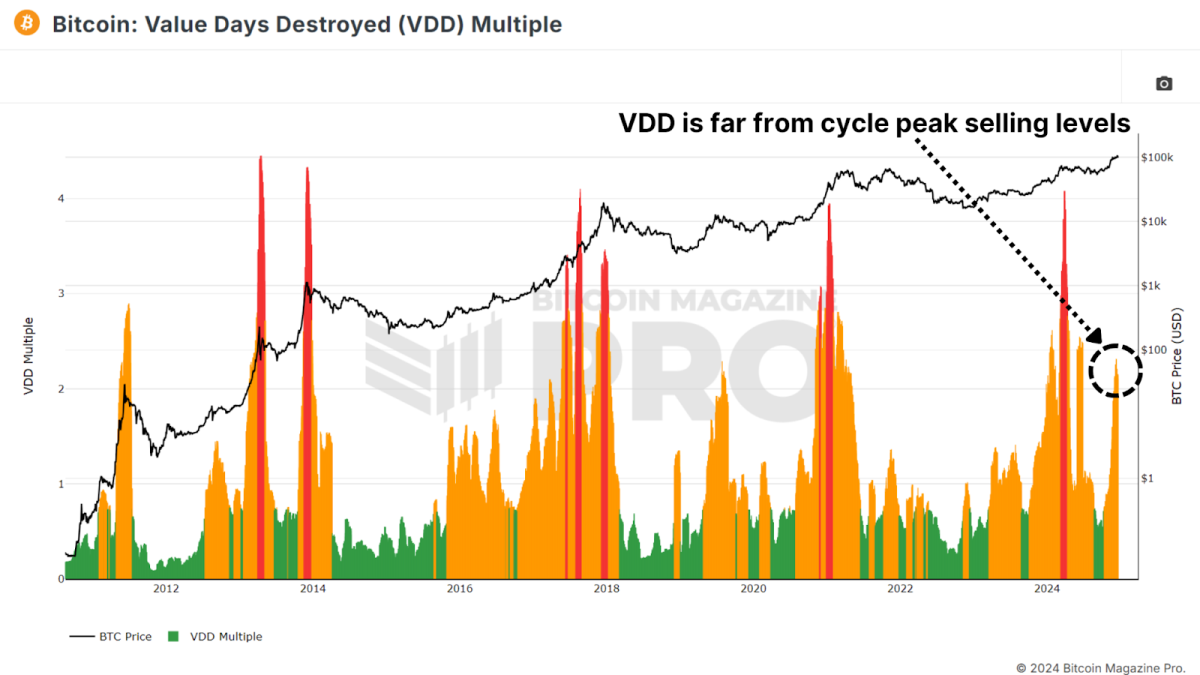
View the graph in real time 🔍
While Bitcoin’s current VDD levels indicate a slightly overheated market, history suggests it could sustain this range for months before peaking. For example, in 2017, VDD indicated overbought conditions almost a year before the peak of the cycle.
Conclusion
Taken together, these metrics suggest that Bitcoin is entering the latter stages of its bull market. While some indicators point to a near-term cooling or slight overextension, most highlight substantial upside remaining through 2025. Key resistance levels for this cycle could emerge between $150,000 and $200,000, with parameters such as SOPR and VDD which provide clearer signals as we approach the peak.
For a more in-depth look at this topic, check out a recent YouTube video here: What’s Happening on Chain: Bitcoin Update
Disclaimer: This newsletter is for informational purposes only and should not be considered financial advice. Always do your research before making any investment decisions.