
Solana failed to clear the $205 resistance and pared gains. SOL price is now below $192 and showing some bearish signals.
- SOL price started a new decline after failing to stay above $200 against the US dollar.
- The price is now trading below $192 and the 100 hourly simple moving average.
- There is a connecting bearish trend line forming with the resistance at $190 on the hourly chart of the SOL/USD pair (data source from Kraken).
- The pair could start a new rally if the bulls break out of the $192 zone.
Solana’s price drops again
Solana price struggled to break above the $200-$205 zone and started a new decline, like Bitcoin and Ethereum. There was a move below the $200 and $192 support levels.
The price even broke below the $185 support. A bottom was formed at $182.20 and the price is now consolidating losses below the 23.6% Fib retracement level of the downside move from the swing high of $223 to the low of $182.
Solana is now trading below $192 and below its 100 hourly simple moving average. There is also a connecting bearish trend line forming with resistance at $190 on the hourly chart of the SOL/USD pair. On the upside, the price is facing resistance near the $190 level.
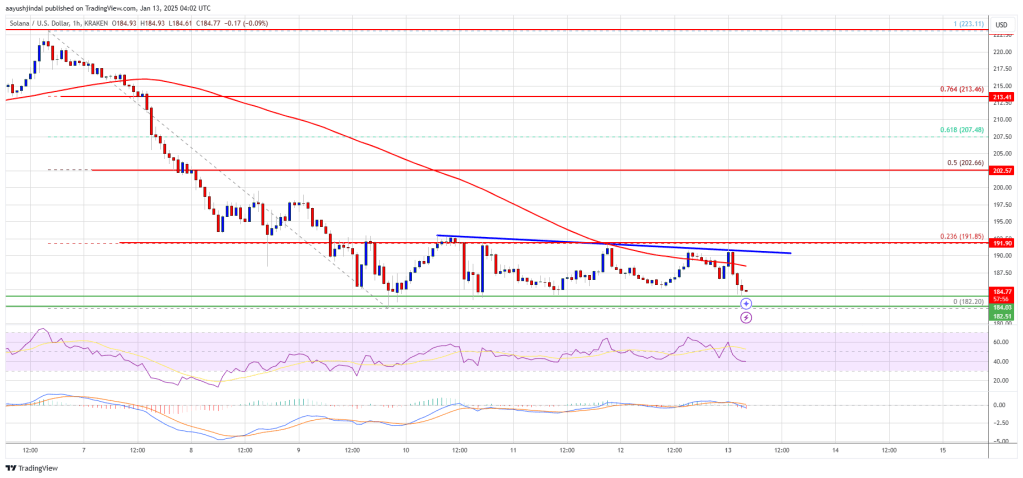
The next major resistance is near the $192 level. Major resistance could be $200 or the 50% Fibonacci retracement level of the downside move from the swing high of $223 to the low of $182. A positive close above the $200 resistance zone could set the pace for another steady increase. The next key resistance is $212. Any further gains could send the price towards the $225 level.
Another drop in SOL?
If SOL fails to clear the $192 resistance, it could begin another decline. Initial support on the downside is near the $182 level. The first major support is near the $180 level.
A break below the $180 level could send the price towards the $175 zone. If a close below the $175 support occurs, the price may fall towards the $162 support in the short term.
Technical indicators
Hourly MACD – The MACD for SOL/USD is gaining ground in the bearish zone.
Hourly RSI (Relative Strength Index) – The RSI for SOL/USD is below the 50 level.
Major support levels: $182 and $180.
Major resistance levels: $190 and $192.