
Bitcoin price is gaining ground above the $100,000 zone. BTC is rising and could accelerate if it breaks above the $102,000 zone.
- Bitcoin has started a decent increase above the $100,000 zone.
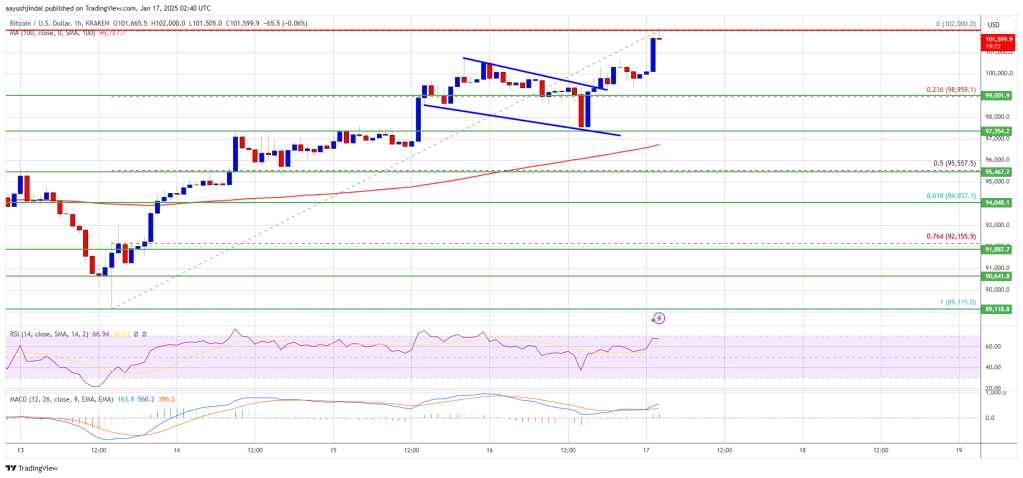
- The price is trading above $100,500 and the 100 hourly simple moving average.
- There was a break above a short-term descending channel with resistance at $99,400 on the hourly chart of the BTC/USD pair (data feed from Kraken).
- The pair could start another rally if it stays above the $100,000 support zone.
Bitcoin Price Recovers $100,000
The price of Bitcoin has started a decent upward movement above the $98,000 zone. BTC managed to break above the $98,500 and $98,800 levels.
The bulls managed to push the price above the key barrier of $10,000. The price even exceeded $101,500. Additionally, there was a break above a short-term descending channel with resistance at $99,400 on the hourly chart of the BTC/USD pair.
A high has formed at $102,000 and the price is now consolidating gains and is well above the 23.6% Fib retracement level of the upward move from the swing low of $89,115 to the high of $102,000.
Bitcoin price is now trading above $100,800 and the 100 hourly simple moving average. On the upside, immediate resistance is near the $102,000 level. The first key resistance is near the $102,500 level. A clear move above the $102,500 resistance could push the price higher. The next key resistance could be $104,000.
A close above the $104,000 resistance could push the price higher. In the case in question, the price could rise and test the $106,000 resistance level. Any further gains could send the price towards the $108,500 level.
Downward correction in BTC?
If Bitcoin fails to break out of the $102,000 resistance zone, a downside correction could begin. Immediate downside support is near the $100,500 level. The first major support is near the $100,000 level.
The next support is now near the $95,500 zone or the 50% Fibonacci retracement level of the upward move from the $89,115 low to the $102,000 high. Any further losses could send the price towards the $93,500 support in the near term.
Technical indicators:
Hourly MACD – The MACD is now gaining ground in the bullish zone.
Hourly RSI (Relative Strength Index) – The RSI for BTC/USD is now above the 50 level.
Major support levels: $100,500, followed by $100,000.
Major resistance levels: $102,000 and $102,500.