
BNB price is consolidating above the $675 support zone. The price is consolidating and may aim for a fresh rise above the $700 resistance.
- BNB price struggles to stabilize above the $700 pivot zone.
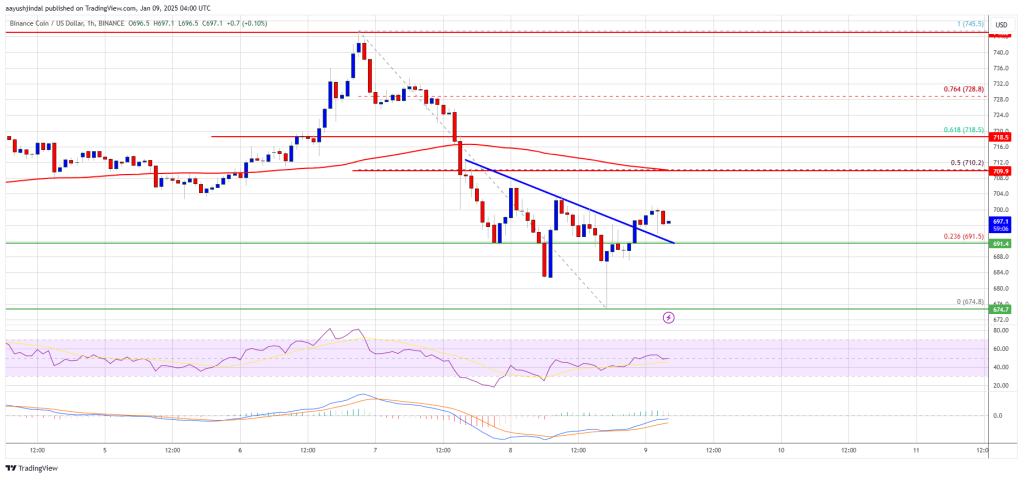
- The price is now trading below $700 and the 100 hourly simple moving average.
- There was a break above a bearish trend line connecting with the resistance at $695 on the hourly chart of the BNB/USD pair (data source from Binance).
- The pair needs to stay above the $680 level to start another rally in the near term.
BNB price holds support
After a bearish correction, BNB price found support at $675. Now it is recovering losses like Ethereum and Bitcoin. There was a move above the $685 level.
The price was able to recover above the 23.6% Fib retracement level of the downside move from the swing high of $745 to the low of $674. There was also a break above a Bearish trend line connecting with the resistance at $695 on the hourly chart of the BNB/USD pair.
The price is now trading below $700 and the 100 hourly simple moving average. If a fresh rise occurs, the price may face resistance near the $700 level. The next resistance lies near the $710 level or the 50% Fibonacci retracement level of the downside move from the $ swing high 745 to the low of $674.
A clear move above the $710 zone could push the price higher. In this case, the price of BNB could reach $725. A close above the $725 resistance could set the pace for a larger move towards the $740 resistance. Any further gains may require a test of the $750 level in the near term.
Another dive?
If BNB fails to clear the $710 resistance, another decline could begin. Initial support on the downside is near the $685 level. The next major support is near the $675 level.
The main support is located at $650. If a break below the $650 support occurs, the price may fall towards the $642 support. Any further losses could initiate a broader decline towards the $625 level.
Technical indicators
Hourly MACD – The MACD for BNB/USD is losing pace in the bearish zone.
Hourly RSI (Relative Strength Index) – The RSI for BNB/USD is currently above the 50 level.
Major support levels: $685 and $675.
Major resistance levels: $700 and $710.