
What a wild ride for BTC USD and cryptocurrency investors! The largest liquidation series ever in the history of cryptocurrencies, eliminating 1,600,000 traders for a total loss of $20 billion. What hopes remain to hold on to the future of BTC? Will price continue to explore ATH or is the revolutions over? Follow along as we uncover the insights hidden in the infographics.
The strategy held 220 BTC for approximately $27.2 million at a price of $123,561 per BTC and has generated a BTC return of 25.9% since the beginning of 2025. As of 10/12/2025, we have 640,250 $ Bitcoin It was acquired for approximately $47.38 billion at a price of $74,000 per bitcoin. $MSTR $STRC $STRK $STRF $You will reply https://t.co/v3IsCOaoeQ
-Michael Saylor (@saylor) October 13, 2025
Meanwhile, the strategy continues to slowly shift DCA into Bitcoin, purchasing another $22.7 million worth. Michael Saylor never seems to lose his conviction, which may be a ray of hope for some. Since Wyckoff liked to use the “Composite Man Theory” (the Composite Man is the market maker) and I would add “Collective Mind,” it is good to remember that price is also determined by what most investors consider low or high. Which causes fluctuations.
Has the collective mind decided that one Bitcoin is a bit too expensive right now? What does the chart say – ring ding ding…
DISCOVER: 12+ cryptocurrency previews you can buy right now
BTC USD at Support: What Comes Next?
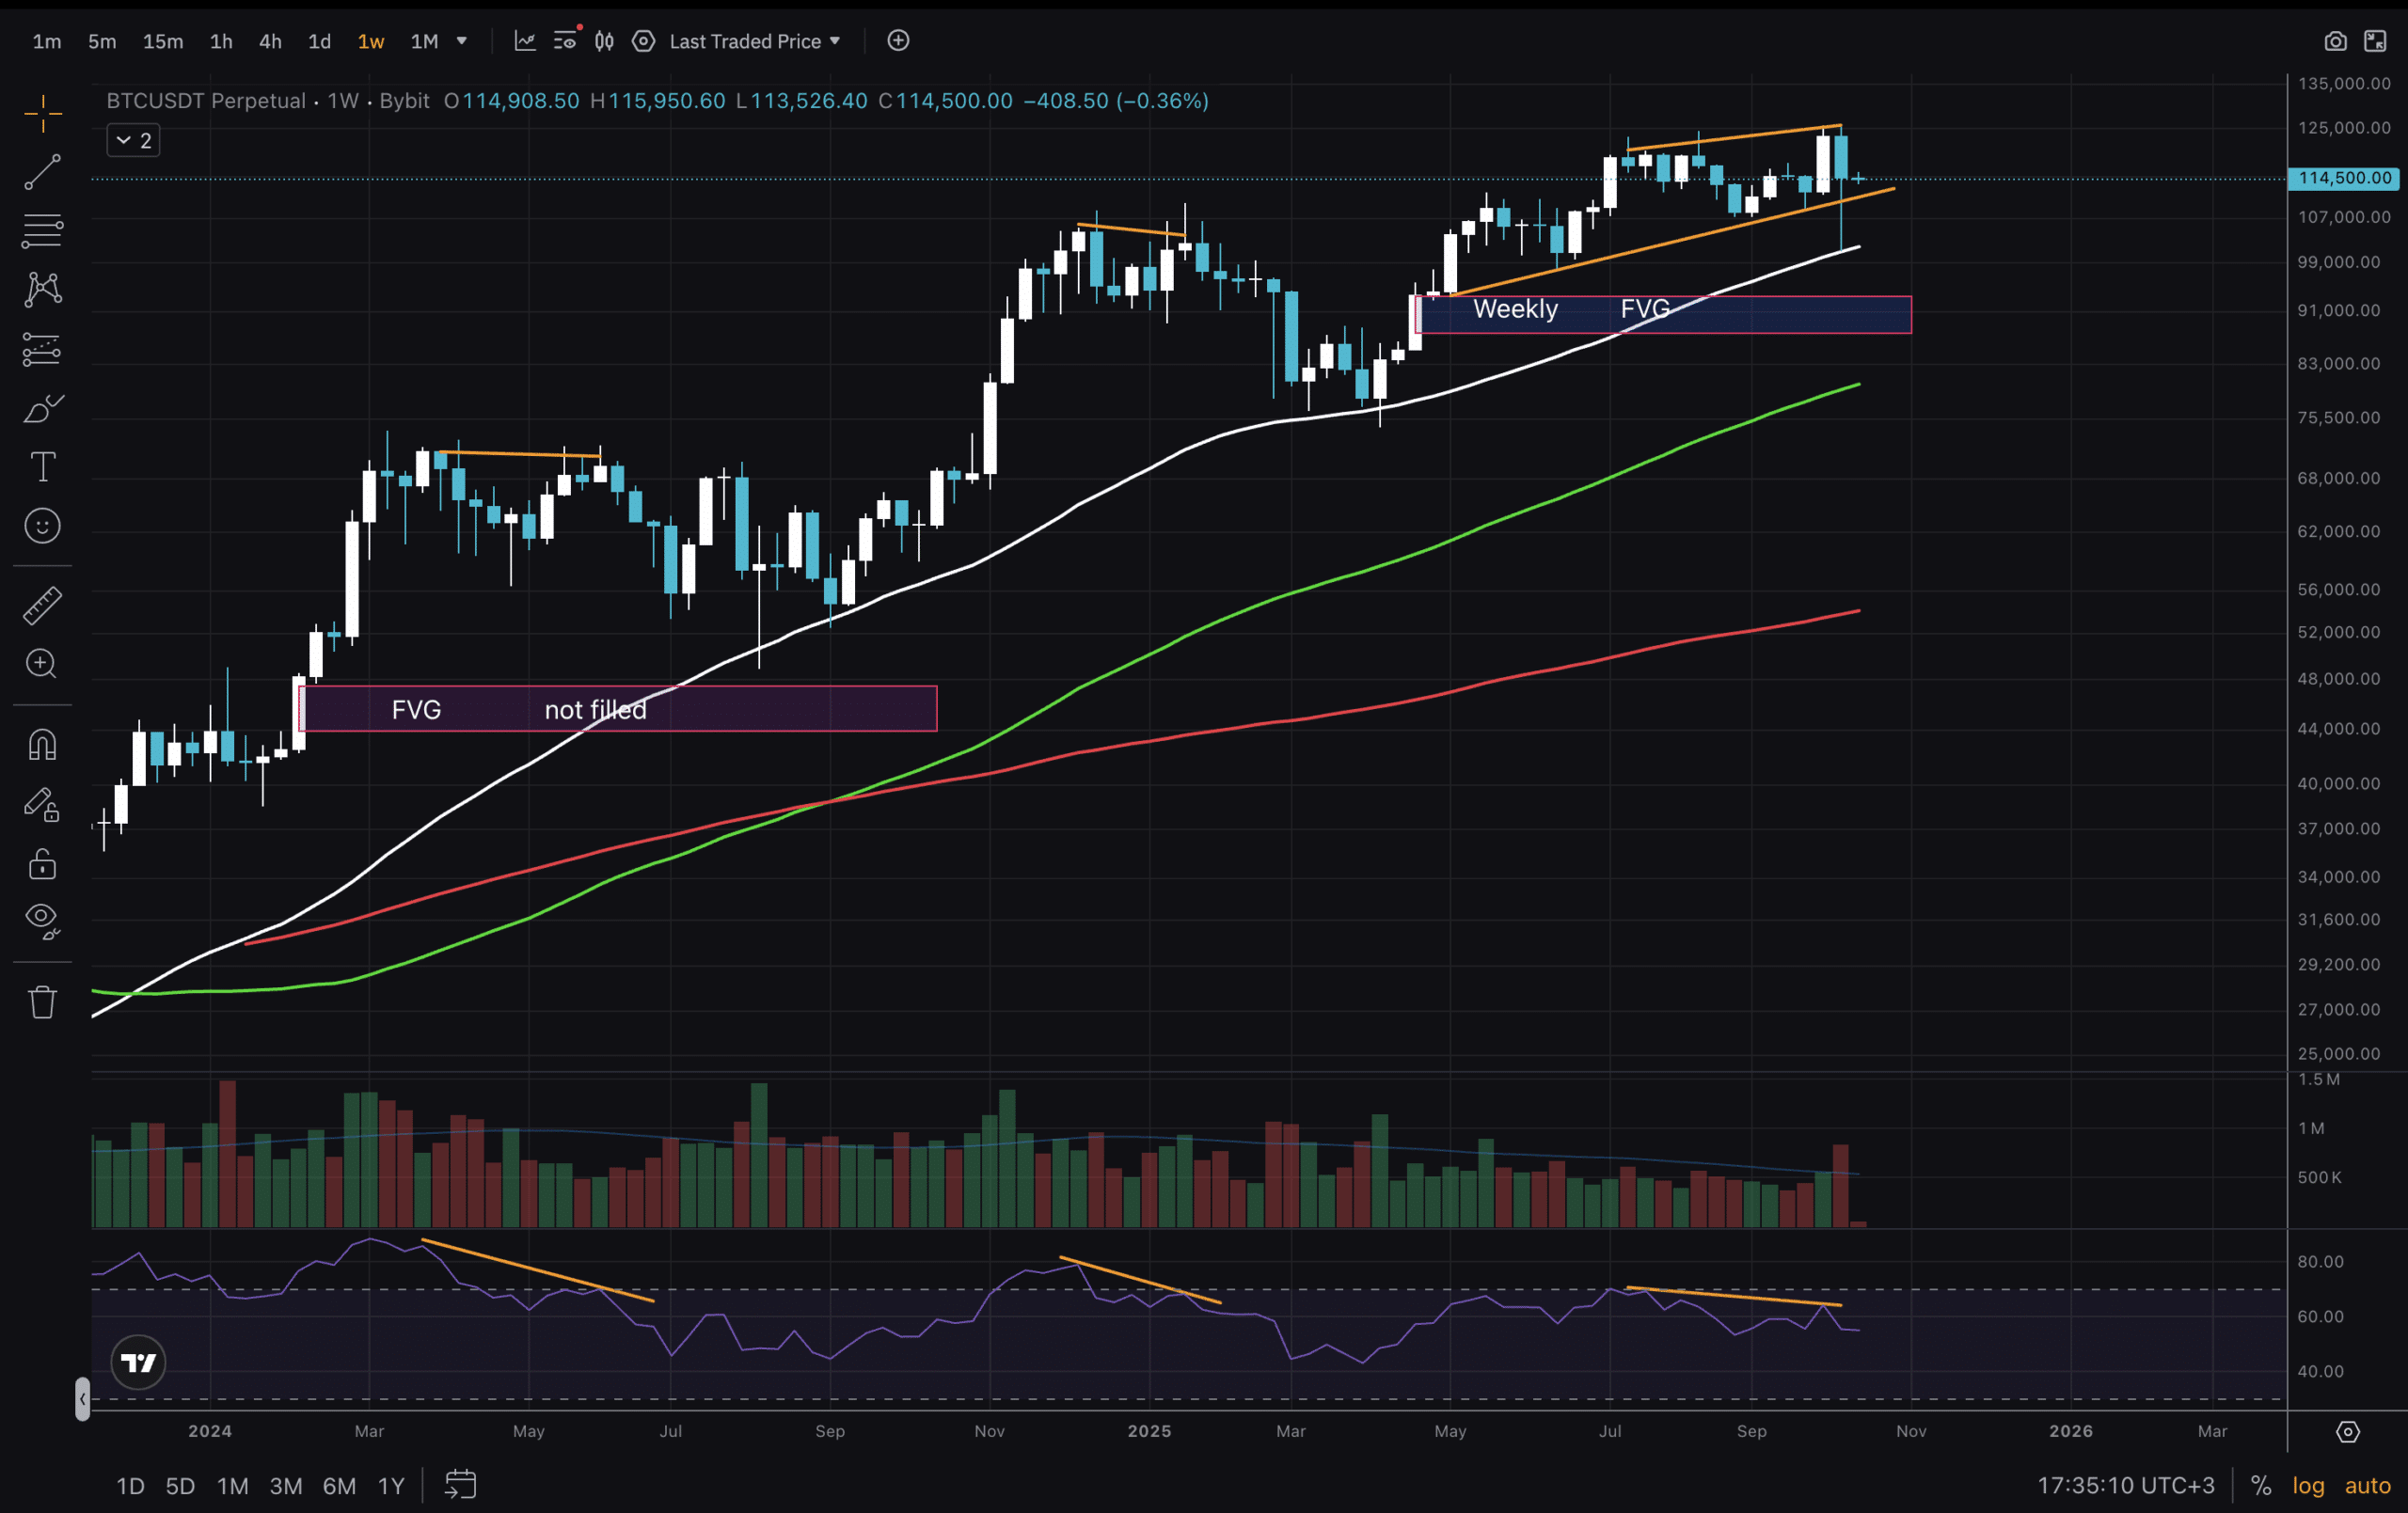
(Source – Tradingview, BTCUSD)
Before you read today’s analysis, please read last week’s analysis, if you haven’t already.
Today we start with the weekly time frame, as usual. Even though we looked at it 3 days ago – we just got a weekly close! This is important. Our wick fell below the trend line and touched MA50. The RSI shows a hidden bearish divergence against the rising price. Not great. Although the weekly FVG is not yet filled and the candle closed above the trend line. BTC USD maintains support so far!
Discover: The best new cryptocurrencies to invest in 2025
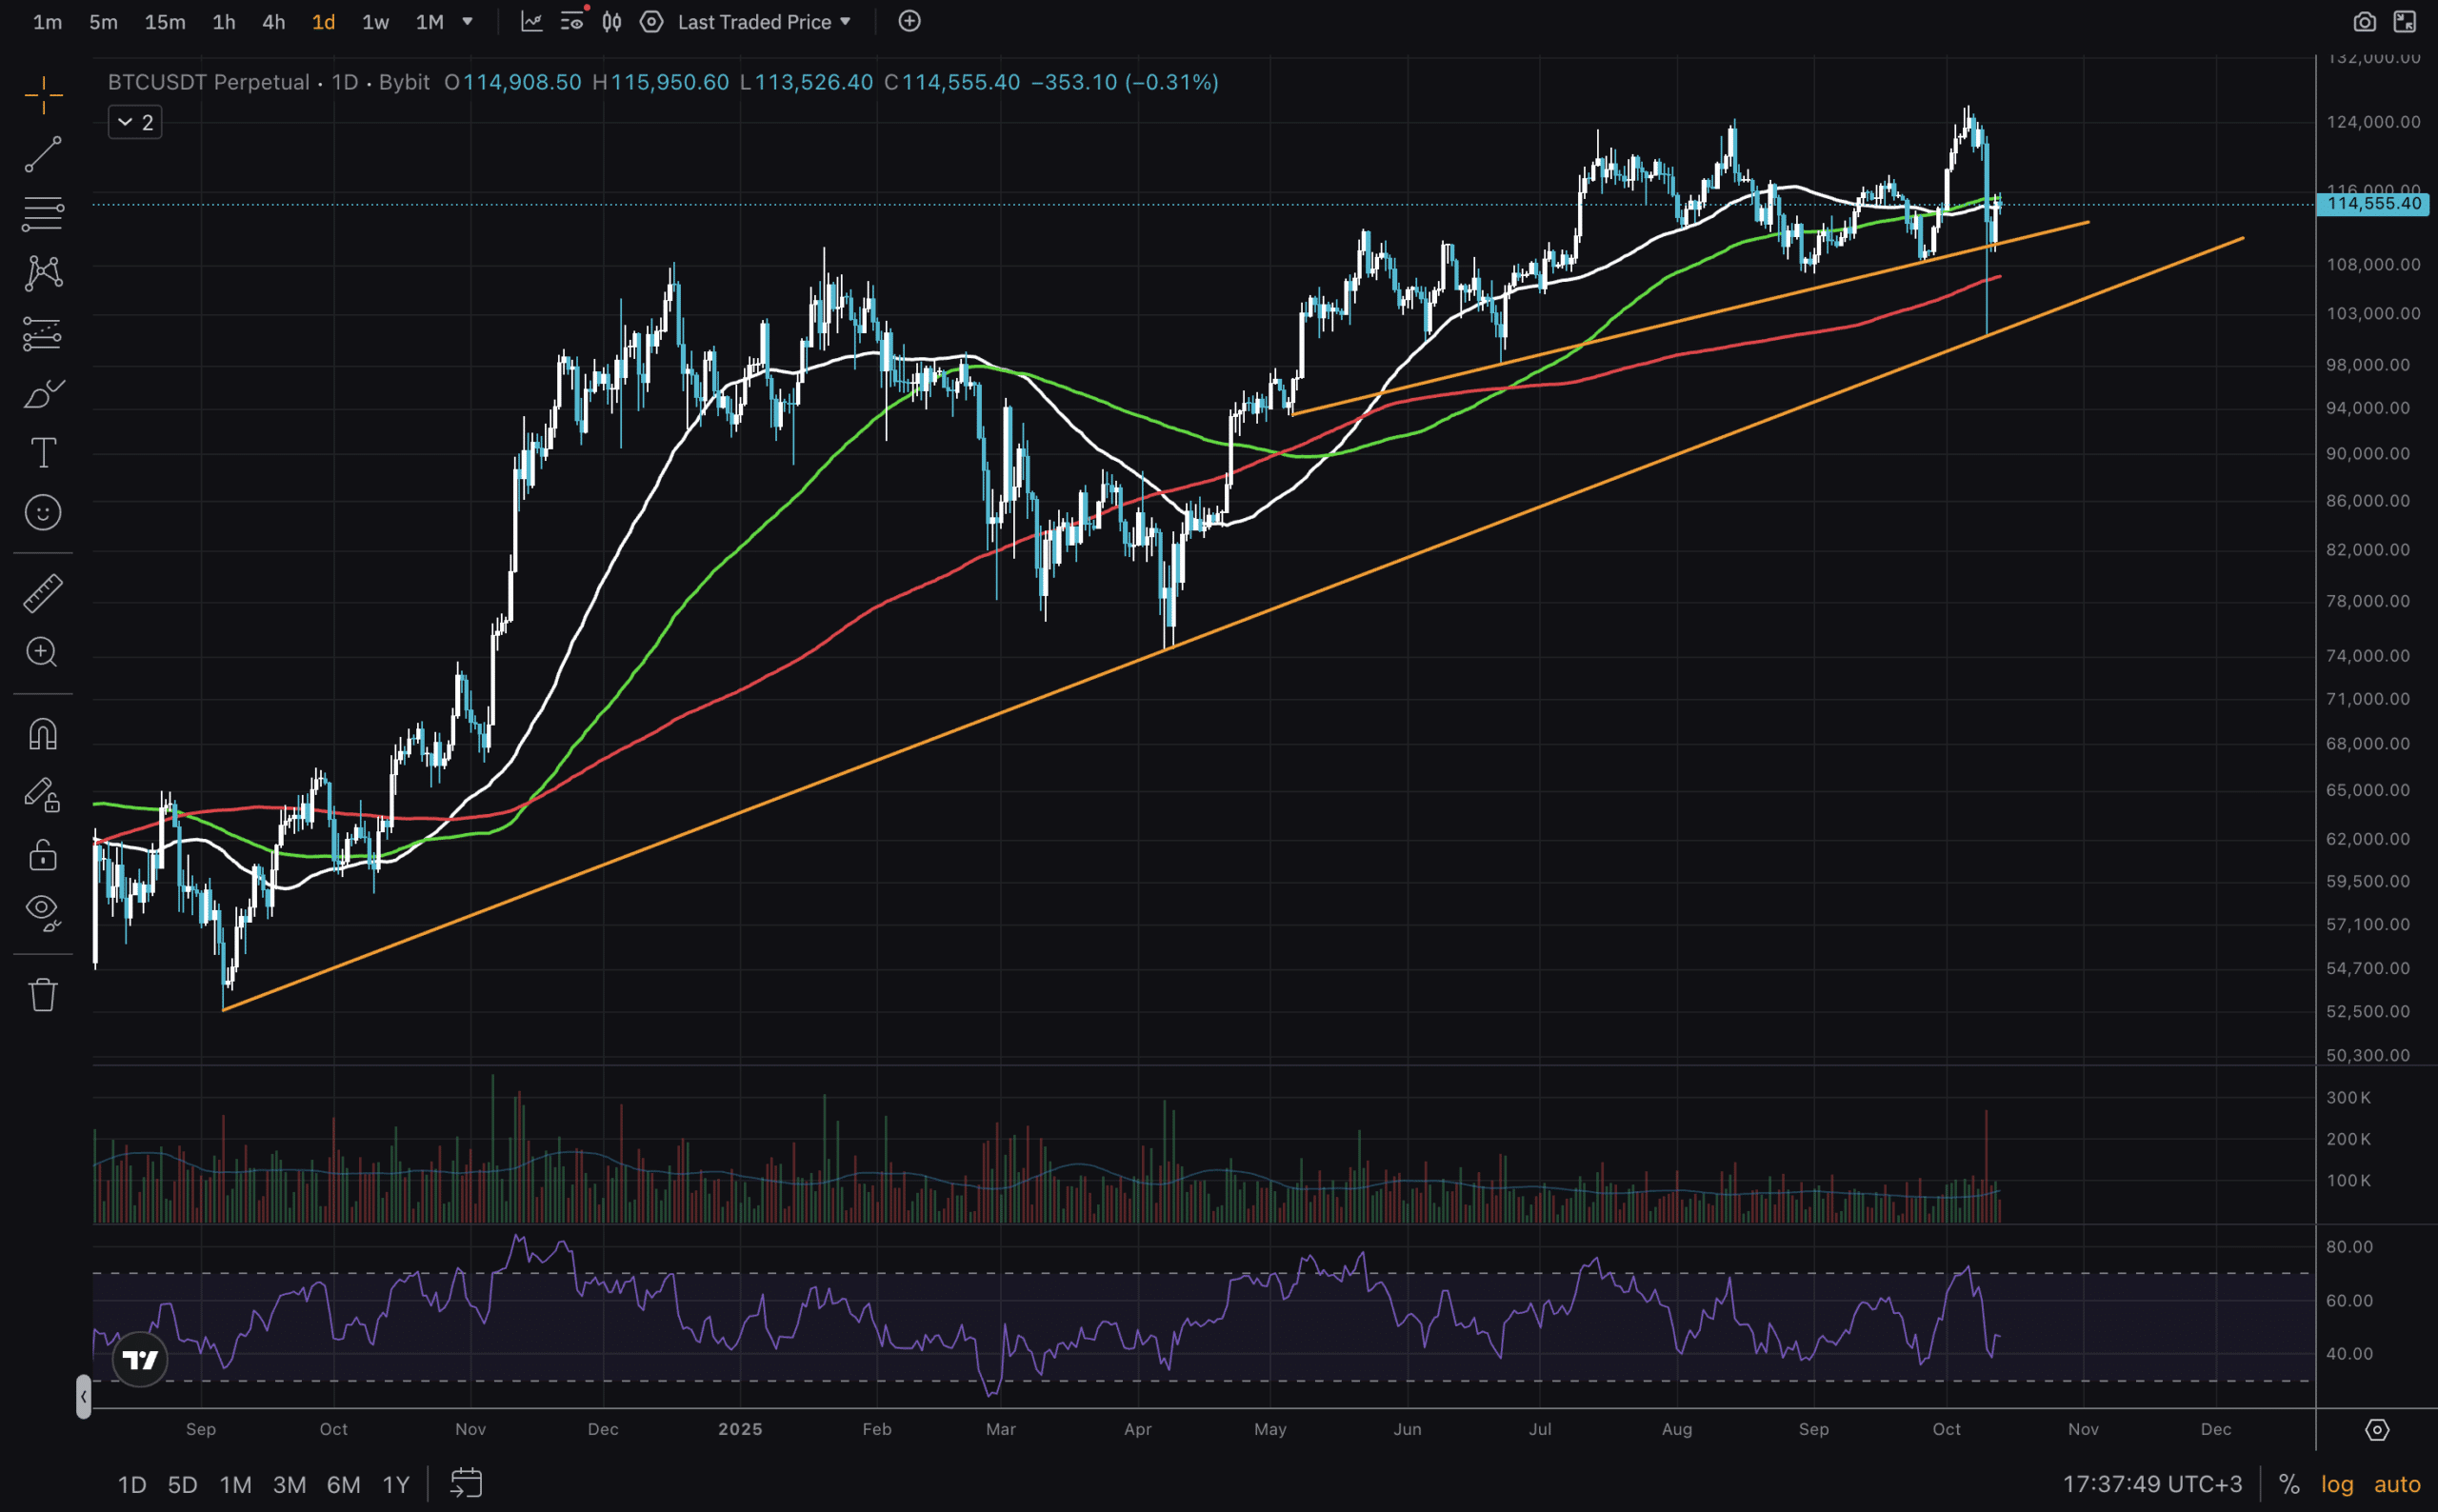
(Source – Tradingview, BTCUSD)
On the daily time frame we add another trend line to note the support of a lower time frame than the weekly. However, it is good to keep in mind that diagonal lines can be deceiving. However, we also see the price breaking below the MA50 and MA100, and breaking through the MA200.
Currently, BTC is on the 1D trend line and above the MA200, but below the MA50 and MA100. The bulls’ preferred scenario is to reclaim those moving averages – only then can we see a new ATH.
Discover: 20+ Upcoming Cryptocurrencies That Will Explode in 2025
Should I sit on my hands?
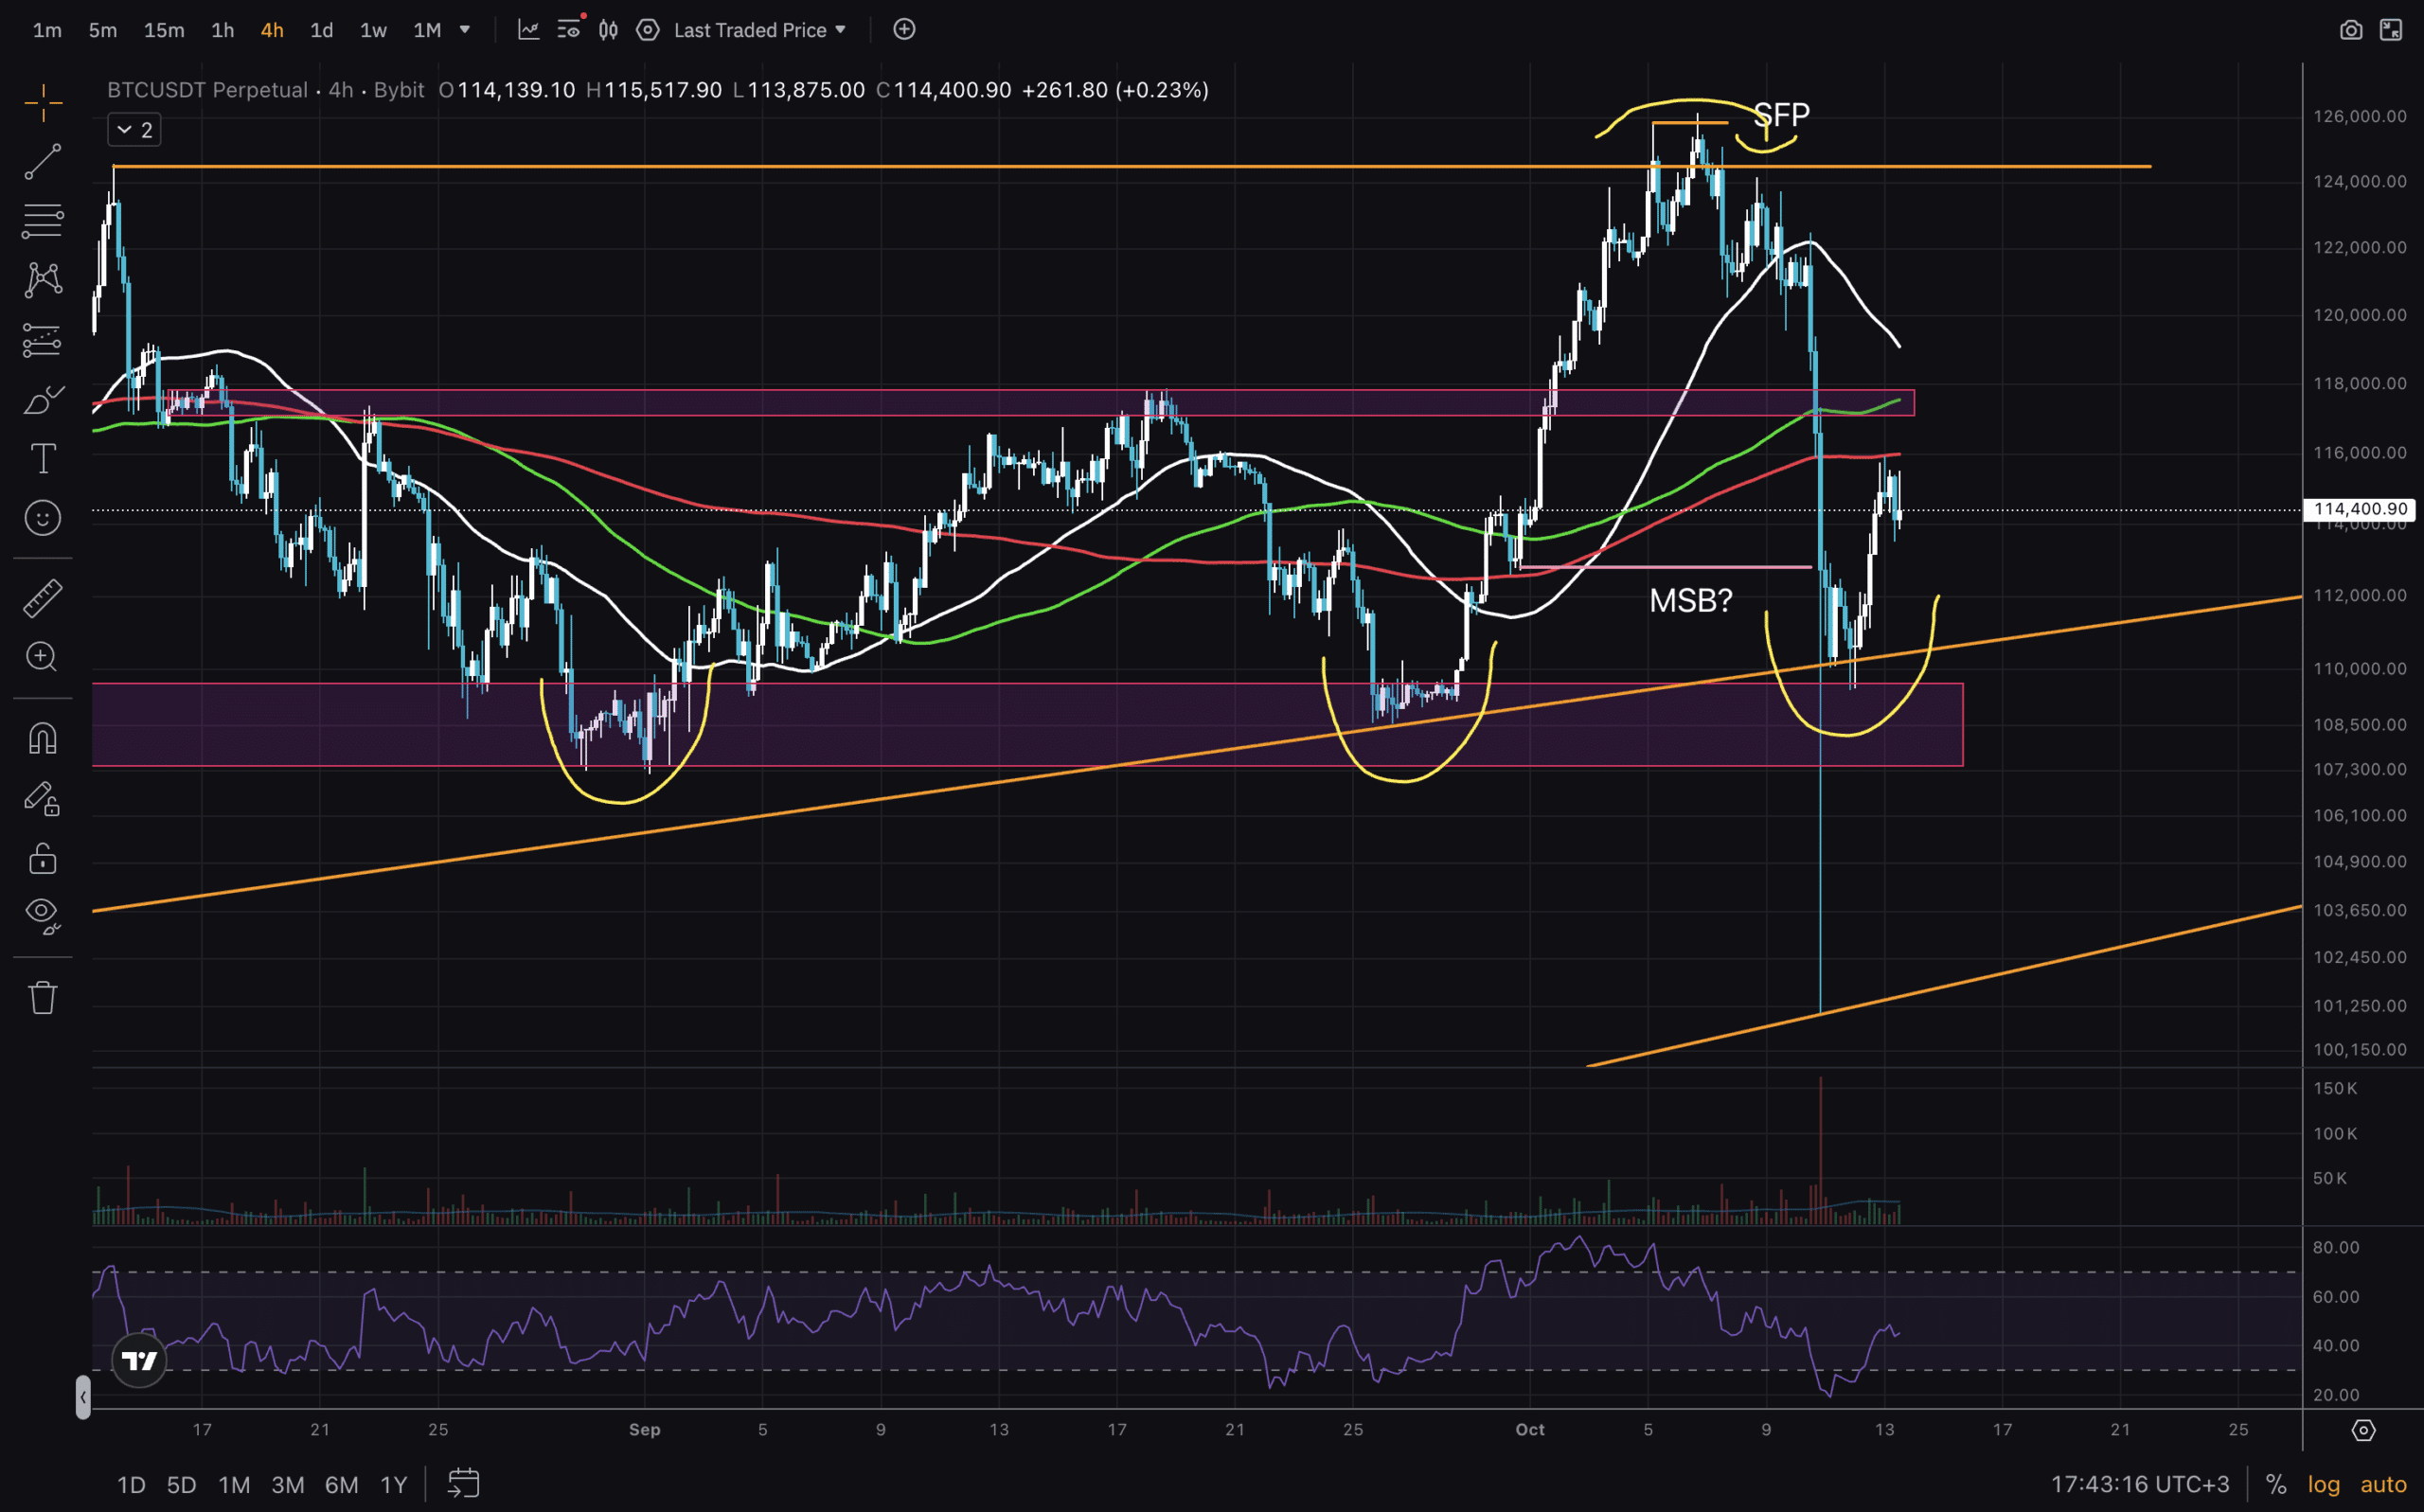
(Source – Tradingview, BTCUSD)
Well, this is not an article about financial advice. We can only discuss what experienced traders would do. They will likely wait to see how the next few days move the market. For this purpose, we will end with a chart of the 4-hour time frame.
A lot of heavy buying has absorbed the selling pressure from the liquidation series. The price fell to the weekly trend line and managed to close above the $107,000-$110,000 demand block. So far, so good. But we are also below all moving averages in this LTF. Reclaiming the $117,000-$118,000 level is crucial. If not – we can expect the weekly FVG to be full.
Stay safe out there!
Discover: The 20 best cryptocurrencies to buy in 2025
Join the 99Bitcoins News Discord here to get the latest market updates
USD BTC Hold Support: What Can Traders Expect?
-
The first major hold level ($117,000) was broken. Next $110,000
-
The 1D chart shows bearish factors, but the structure is still bullish
-
Weekly FVG at $86,000 – $92,000. Will it be filled?
-
The key level that needs to be broken for bullish continuation is $117,000 – $118,000.
BTC USD Hold Support: What Can Traders Expect? appeared first on 99Bitcoins.
**mind vault**
mind vault is a premium cognitive support formula created for adults 45+. It’s thoughtfully designed to help maintain clear thinking